
log
2026-7-6:
matplotlib + scienceplots(提供期刊模板),好像也不是很好看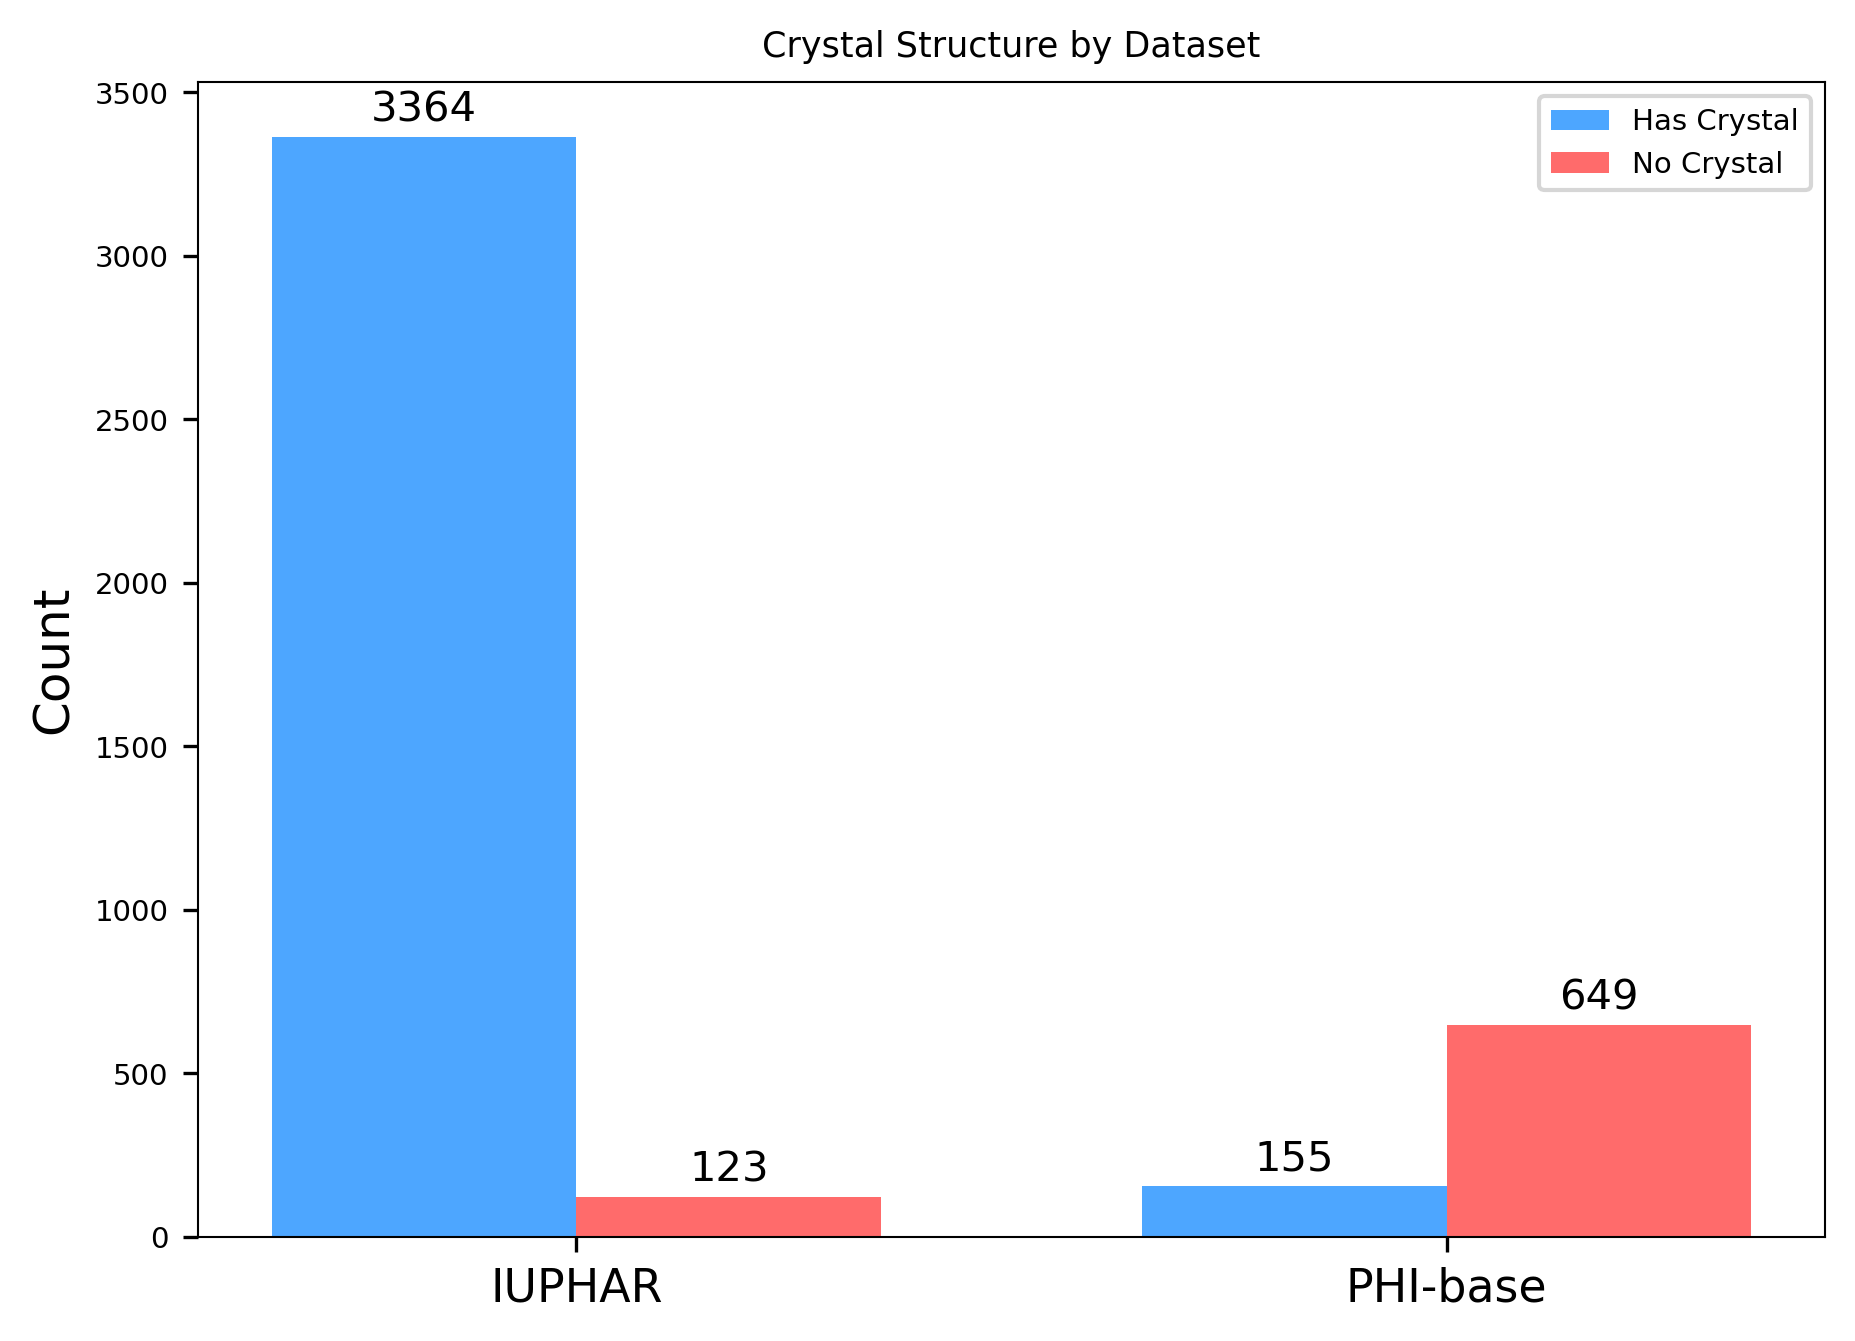
2026-7-4:
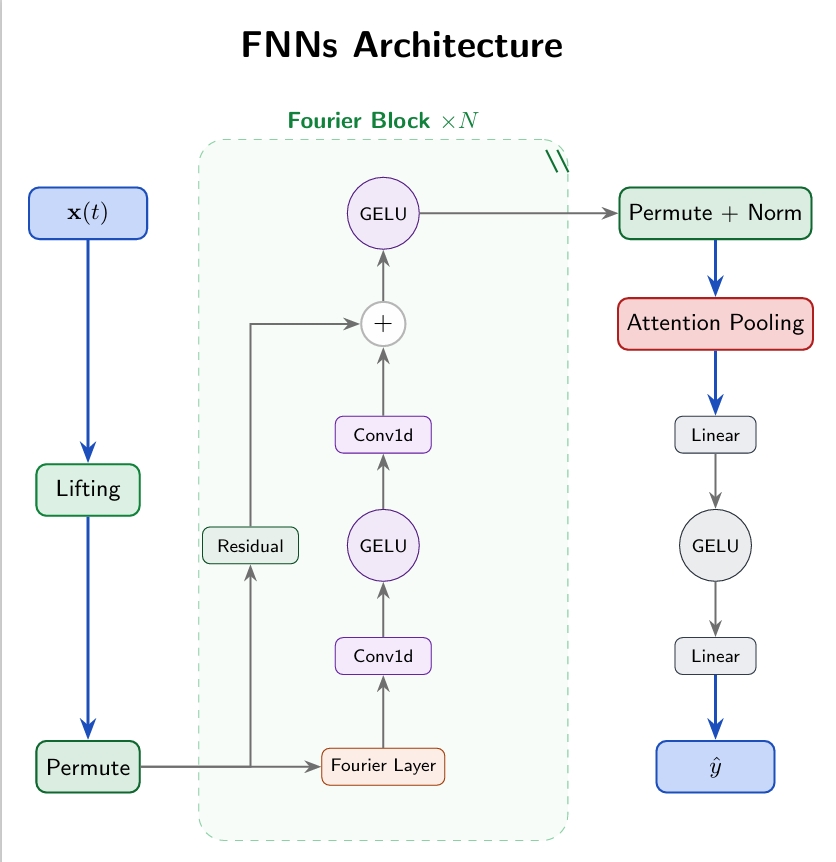
FNNs的模型架构图,用pdflatex绘制:
pdflatex安装:
sudo pacman -S texlive-core
sudo pacman -S texlive-latexextra texlive-fontsrecommended
pdflatex --version
/或者用overleaf
Ai写.tex文件
产生以下流程图:
2026-7-2:
测试一下matplotlib、plotly和fastplotlib
工作路径: ~/D3Pockets/D3Pockets_2.7.2/test_FIFP
环境:tmp(install fastplotlib,plotly,conda install -c conda-forge imageio
原脚本结果完好。新脚本已完成,总结:
topology_manifolds_interactive.py 已创建:
- 分析逻辑:与原脚本完全一致(临界点识别、流形计算、
子系统识别)
- 可视化:
- plotly → 输出交互式 HTML(可旋转/缩放/悬停查看信息)
- fastplotlib → 输出 PNG 截图 + 交互窗口(需 display
环境)
- CLI:简化为 --system、--all、--resolution 三个参数
- 输出目录:*_manifolds_interactive/,不覆盖原结果
- 默认参数:n_manifold_points=12(原脚本为 24,更快)
用法:
conda run -n tmp python test_FIFP/
topology_manifolds_interactive.py --system
betaA2_active_diff_filter --resolution 32
conda run -n tmp python test_FIFP/
topology_manifolds_interactive.py --all --resolution 16